
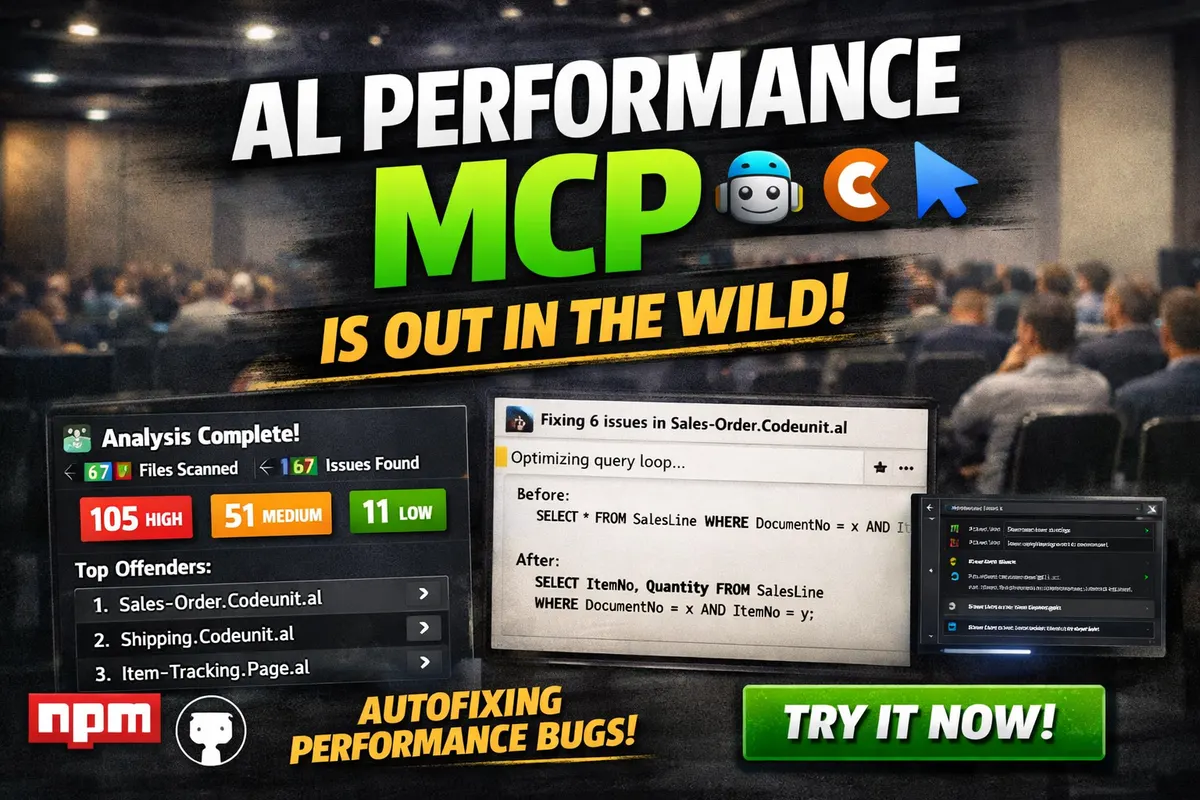
The AL Performance MCP
At BC TechDays 2026, I did a workshop about AL Performance, where I covered 40+ exercises with attendees. I also had one thought, why not make MCP with knowledge of that workshop? So I did it, and it was premiered at BC TechDays 2026. Now it’s time to share with the rest of you.
If you’ve ever stared at a slow page in Business Central, opened SQL Profiler, and gone “why on earth is this fetching 100 columns for a lookup?” — this one’s for you.
So what is it, in one breath?
It’s an MCP server (Model Context Protocol — the thing that lets AI assistants call real tools) that plugs straight into GitHub Copilot, Claude Desktop, or Cursor. Once it’s wired up, you just talk to your AI the way you already do:
“Use al-performance to analyze this project.”
…and it reads your AL code, finds the performance sins, ranks them by how much they’ll hurt, hands you a phased action plan, and for a good chunk of them, just fixes them for you. No new window. No pasting code into some external analyzer. No leaving your editor. It all happens in the chat.
Why I built it
Here’s the thing about AL performance problems: they’re almost never exotic. It’s the same dozen mistakes, over and over, across every codebase I’ve ever reviewed. CalcFields() firing once per row. Count() <> 0 when a simple IsEmpty() would do. A record loaded without SetLoadFields, dragging every table extension column across the wire.
None of it is hard to fix once you see it. The problem is seeing it at scale, across hundreds of files, without spending your whole week doing code review by hand. That’s exactly the boring, repetitive, pattern-matching job that AI is genuinely good at. So, I taught it the patterns.
What it actually does
Let me just show you. Here’s the tool pointed at a real project, the same one my workshop attendees tore apart. One sentence in the chat, and this comes back:

One prompt → a full workspace scan. 67 files, 167 issues, grouped by category and severity.
67 files, 167 issues, sorted into 105 HIGH / 51 MEDIUM / 11 LOW and broken down by category — data transfer, locking, aggregation, memory, and so on. That’s the whole codebase x-rayed in a few seconds.
It tells you where to look first
167 issues sounds terrifying until the tool ranks them for you. Every file gets a weighted severity score (a HIGH counts for a lot more than a LOW), so you get a “worst offenders” list and know exactly which files are worth your afternoon:

The top 10 worst files, ranked by weighted score, with the exact patterns each one triggers.
Then it hands you a plan
This is my favourite part. Instead of dumping a wall of findings on you, it builds a phased action plan: Phase 1 is everything it can auto-fix for you (zero manual effort), Phase 2 is the high-severity stuff that needs a human, Phase 3 is the medium nice-to-haves. You always know what to do next.

A phase-by-phase plan. Start with the free wins, then the ones that actually need your brain.
And it explains itself
It’s not a black box shouting “BAD CODE” at you. Ask about any pattern and it’ll explain the root cause, show you the SQL the database actually runs in each case, and give you a before/after. It’s honestly a pretty great way to learn AL performance, not just patch it.

Every pattern comes with the “why” — the actual SQL, the O(N)-vs-O(1) story, and a fix.
The numbers
38anti-patterns detected
12performance categories
11fixed automatically
Under the hood there’s a master orchestrator that fans the work out to specialist sub-agents — one for data transfer, one for FlowFields, one for locking, one for bulk operations, and so on — then aggregates everything into that single report. You can also drill into just one category if you want to focus.

The full toolbox: one orchestrator, eleven category scanners, fixers, and the explain/list helpers.
And the 11 auto-fixable ones aren’t risky guesswork, they’re the safe, mechanical transforms. Things like turning Count() <> 0 into not IsEmpty(), Find('-') into FindSet(), adding a missing temporary keyword, or flipping ModifyAll(…, true) to false when you don’t need the triggers. It runs in dry-run mode by default, so you always get a preview before anything touches your files.
Getting it running
No clone, no pip install, nothing to build. It ships on npm and launches through npx, so you just point your AI host at it.
VS Code (GitHub Copilot agent mode) — drop this into .vscode/mcp.json:
{
  "servers": {
    "al-performance": {
      "type": "stdio",
      "command": "npx",
      "args": ["-y", "@bcility/al-performance-mcp"]
    }
  }
}
Claude Desktop — same idea in claude_desktop_config.json, under mcpServers. Cursor and other MCP hosts follow the identical npx -y @bcility/al-performance-mcp pattern.
Then just ask: “List all AL performance patterns.” If you see 38 of them, you’re live.
You’ll need Node.js 18+ (for the launcher) and Python 3.11+ on your machine, and any MCP-compatible assistant.
Go break it
This started as a workshop toy and turned into something I genuinely reach for on real projects. I’d love for you to try it on your own codebase and tell me what it catches, and what it misses. That feedback loop is how it gets sharper.
Point it at your worst codebase. See what falls out. And if you were at BC TechDays 2026, thanks for being the first to kick the tyres. 🚀
Related posts
AL MCP Server for Debugging in Business Central
AI (Claude and Copilot) · 8 Apr 2026

Using AI to Analyze Business Central Snapshots Debugs and Profiles
AI (Claude and Copilot) · 15 Feb 2026

Using AI to Enrich Web Shop Items in Business Central
AI (Claude and Copilot) · 1 Oct 2026
al graph: Auditing Who Can Reach Your Code in AL 18.0
Development · 24 Aug 2026
6 comments
- Juliane
Great idea! Can you tell me if we can see what happens with our code, when we trigger the mcp? It is not open source, so I can’t see what happens, when the mcp reads the codebase.
- Stefan ŠošićAuthor
Well, it’s other way around. It has patterns and best practices, actually MCP looks for bad code in your code. Not the other way around. When you look it like that, it doesn’t read your code at all, it searches for bad patterns and bad practices.
- Dennis
Hey,
the mcp works well! I want to provide some feedback that i noticed while working with this mcp :– the mcp would benefit from a tool “scan_al_file”, so a performance analysis can be done just by entering a file path. Now an Ai agent has to read a file first and then invoke scan_al_code.
– an option to disable a pattern via flag in the mcp config would be nice - Jeffrey Bulanadi
Very well done. al performance mcp idea make sense, and I saw it coming from derive from expertise of al performance thing. Nice one!
- HazardMK
Will it be updated in the future? Or you think we should all just use BCQuality?
- Stefan ŠošićAuthor
At this point, this MCP contains more patterns and can do more findings. Hopefully BCQuality gets them too, but I can't guarantee it.